Lessons learned from a small side project
Building, and SEOptimizing Table to Markdown

Technical challenges
Trojan horse CSS
(I almost wrote "Trojan horCSS" but thought better of it.)
When an HTML element says it's contenteditable="true", it really means it. That element is so editable that it can change an entire page:
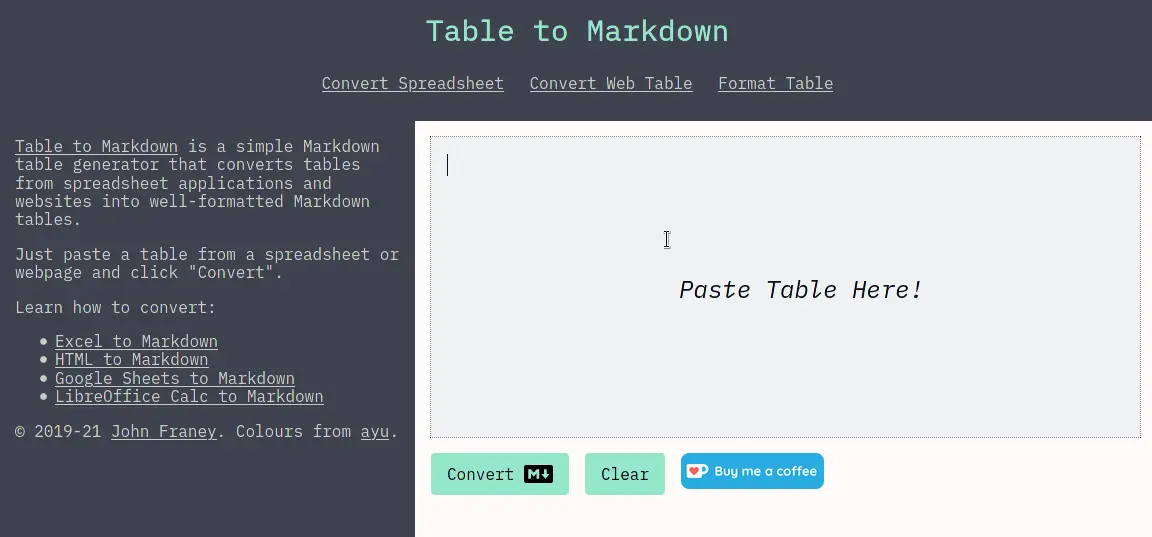
Hey! You stole my font!
What's going on there? On pasting a table from LibreOffice Calc, a secret stylesheet sneaks onto the scene and supersedes some site-wide styling.
// The rest of this Vue.js 2.x class-based component is omitted for brevity
@Component
export default class Editor extends Vue {
  public observer?: MutationObserver = undefined

  mounted() {
   // Prevent adding script and style tags on paste
   this.observer = new MutationObserver(filterForbiddenElements)
   this.observer.observe(this.$refs.pasteBox, { childList: true })
  }

  destroy() {
    if (!this.observer) {
      return
    }
    this.observer.disconnect()
  }
}
To stop this style stick-up, I added a MutationObserver to watch for HTML being added to the paste box and remove any offending elements, like <style> and <script>.
Partial tables
Take a look at this table:

Sure, the table content is selected—but is the table selected? It's hard to say. When I first coded Table to Markdown, selecting from just to the left of "Measurement" and just to the right of "25%" would result in HTML like this being added to the clipboard:
<th>Measurement</th>
<th>Value</th>
<th>Reduction</th>
<tr>
  <td>Max width</td>
  <td>428px</td>
  <td>32%</td>
</tr>
...
If you selected from above the table to below the table? You'd get a full <table> element, complete with a <thead> and <tbody>.
Traffic & SEO
For me, most of the fun of publishing side projects is having numbers to look at. It's even more fun if the numbers go up, so let's take a look at some numbers that go up and a couple ways to steer them in that direction.
Web traffic
First, let's take a look at web traffic since launch. I say "launch", but that's not quite true. The first real mention of Table to Markdown was in this blog post from December 9, 2019. That post got a decent amount of traffic, and 41 users decided to check out a "pre-launch version" of Table to Markdown, resulting in the first little spike near the y-axis:

The next big spike is in March 2021, and although I got excited when I first saw that traffic, I'm pretty sure that was bot traffic. Let's pretend that last spike doesn't exist.
Take another look at that chart, and look at the numbers going up! It's a slow and steady climb, but in a bit over a year, the site went from almost no traffic in a day to what looks to be peaks of around 150 users.
Speaking of peaks: what's up with all those ups and downs? It looks like a chart of yo-yo distance from the ground. It turns out that there is a good reason for those peaks and valleys: weekends.
If we zoom into the four weeks ending April 14, 2021, we can see that Saturday (March 20th & 27th, April 3rd & 10th) is consistently the slowest day of the week, with Sunday right behind:

What can we learn from this? In all likelihood, people are using Table to Markdown at work. Wednesday is often slower than Monday, Tuesday, and Thursday, too. Hump day? More like slump day.
Now that we've seen some numbers that go up, let's check out some more: organic search traffic.
Google traffic
Remember that graph "Users November 28, 2019 — March 31, 2021"? If we ignore that bot spike in March, the user traffic correlates well with the number of clicks per day from Google searches:

It correlates almost too well, doesn't it? A person might think that virtually all my traffic comes from Google. Well, a person thinking that would be wrong! Well, wrong. Okay: just a little wrong.
Here are the top 8 sources user traffic as of April 14th, 2021:
- Google (77.4%)
- Direct (9.5%)
- Bing (5.5%)
- DuckDuckGo (3.4%)
- Bing (China) (0.93%)
- My blog (0.57%)
- Ecosia (0.49%)
- GitHub (0.32%)
More than three out of every four users finds Table to Markdown via Google, and almost one in ten come to the site directly (presumably by copying a link from a search engine or social media instead of clicking it).
At first glance, non-Google, non-direct traffic is coming from all over. Apart from my blog and GitHub, though, there's sort of one source that accounts for 10% of my traffic: Bing.
Bing? Oh, right. Bing

If website users were money and Bing were a banana stand:

10% of users may not seem like a ton, but Google wasn't always my top source of traffic. Something I didn't expect when the site was young is that I got more traffic from Bing than I did from Google. (Good thing I submitted a sitemap to Bing Webmaster Tools!)
In the first three months after launch, I had 21 users from Google, and 34 users from Bing:

What about that other organic search traffic? Well, DuckDuckGo also uses Bing for most of its regular search results, as does Ecosia. Knowing that, Table to Markdown had 3x the traffic from Bing-powered search engines than from Google in the early days, and around 10% overall.
Don't forget about Bing!
To "convert" or not convert
My web copy focused on "converting" from a number of sources to Markdown, but as we can see from the following impression count, most users search how to generate Markdown tables:

Because of this, my click-through rate (CTR) for queries containing "convert" is pretty solid! I was a bit penny-wise, pound-foolish in this case because I optimized for less-common search terms instead of the most common search term for my content.
Take-aways
- Clipboard HTML can be a mangled mess, and pasting it into a content editable div can bork your site
- Submit a sitemap to Bing Webmaster Tools
- Use language that searchers use to describe your site and content